No products in the cart.

Slack Introduces Vibe-Coding for Interactive Reports and Charts

Slack has launched vibe-coding, a new feature that allows users to create interactive reports and charts within chat conversations, enhancing collaboration and productivity.

Slack has launched a new feature called vibe-coding. This tool lets users create interactive reports and charts within chat conversations. Unveiled on September 10, 2026, it aims to boost collaboration by integrating AI into the Slack platform. Users can describe their reporting needs to Slackbot. The bot gathers relevant information from conversations and connected apps like Google Drive and Salesforce. It then produces visualizations that can be shared and discussed in real-time.
This development is important for data analysts and project managers. They rely on effective communication and data visualization to drive projects forward. By allowing reports and dashboards to be created directly in Slack, this feature reduces the need to switch between multiple applications. This streamlines workflows and boosts productivity.
Transforming Data Reporting in Slack
The introduction of vibe-coding changes how data reporting is done in Slack. Users can create interactive charts and reports by simply asking Slackbot for help. This feature simplifies data visualization and promotes a collaborative environment. Team members can easily interact with the data being presented.
According to Gizmodo, the vibe-coding tool meets various business needs. Users can create everything from polls to complex dashboards. This versatility allows project managers to tailor their reporting to specific project requirements. It ensures that all stakeholders have access to easy-to-understand information.
Furthermore, AI integration allows for dynamic interaction with data. As Slackbot gathers information from different sources, it presents insights that may not be obvious. This helps teams make informed decisions based on real-time data analysis. This capability is especially useful for data analysts who often interpret large datasets and share findings.
Career Ahead’s analysis shows that vibe-coding will likely reduce the time spent on data reporting tasks. By cutting down on manual data entry and repetitive tasks, teams can focus more on analysis and strategy. This ultimately leads to better project outcomes.
As more organizations adopt remote work, effective communication tools like Slack are crucial.
You may also like
 AI & Technology
Concerns Rise Over AI Safety as OpenAI Employee Resigns
David Robinson's resignation from OpenAI raises significant concerns about AI safety protocols and ethical practices in the tech industry, reflecting a growing trend of discontent…
Read More →As more organizations adopt remote work, effective communication tools like Slack are crucial. The vibe-coding feature strengthens Slack’s position as a leading collaboration platform. It becomes an essential tool for teams looking to improve productivity and efficiency.
Enhancing Collaboration and Workflow
The vibe-coding feature is not just about creating reports; it also boosts team collaboration. Users can pin reports and dashboards within channels. This makes it easy for team members to access and comment on the presented data. This fosters transparency and open communication, which are vital in today’s fast-paced work environment.
Moreover, creating interactive reports directly in Slack allows project managers to keep teams updated. This reduces the need for lengthy email threads or external meetings. This shift is especially relevant for teams on tight deadlines, as it allows for quicker decision-making and responsiveness to project changes.
As detailed on the Slack Marketplace, integrating tools like Vibe with Slack helps users organize their work better. Vibe’s features, such as infinite canvases and smart shapes, complement Slack’s capabilities. This provides a comprehensive solution for project management and collaboration. The synergy between these tools enhances the user experience, making it easier for teams to visualize and manage projects.
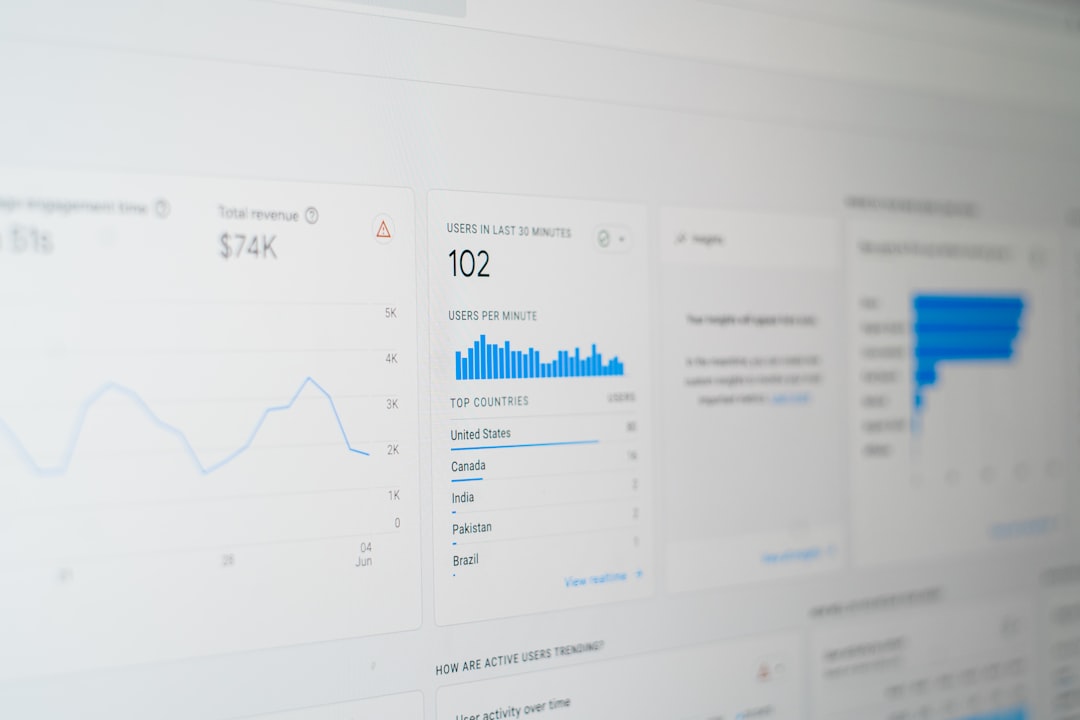
Career Ahead research finds that tools integrating seamlessly into workflows are more likely to be adopted.
Career Ahead research finds that tools integrating seamlessly into workflows are more likely to be adopted. With vibe-coding, Slack addresses the needs of modern teams that demand flexibility and efficiency. This feature meets those demands and sets a new standard for collaboration tools in the tech industry.
As remote work continues to evolve, Slack’s innovations position it as a leader in collaboration. It provides users with the tools they need to succeed in a digital-first world.
Future Implications for Data Analysts and Project Managers
The launch of vibe-coding will likely have lasting effects on data analysts and project managers. As more organizations adopt this feature, expectations for data visualization and reporting will change. Analysts will need to adapt to this new way of presenting data. They will focus on creating engaging and interactive content that can be easily shared and discussed.
You may also like
 AI & Technology
Spotify billionaire’s body scan startup has come to America
Neko Health, co-founded by Spotify's Daniel Ek, has launched its body scan services in the U.S., aiming to transform preventative healthcare with advanced technology.
Read More →Project managers will increasingly rely on real-time data insights for decision-making. The ability to visualize data instantly will help them make quicker adjustments to project plans. This could lead to more successful outcomes and redefine project management, emphasizing agility and responsiveness.
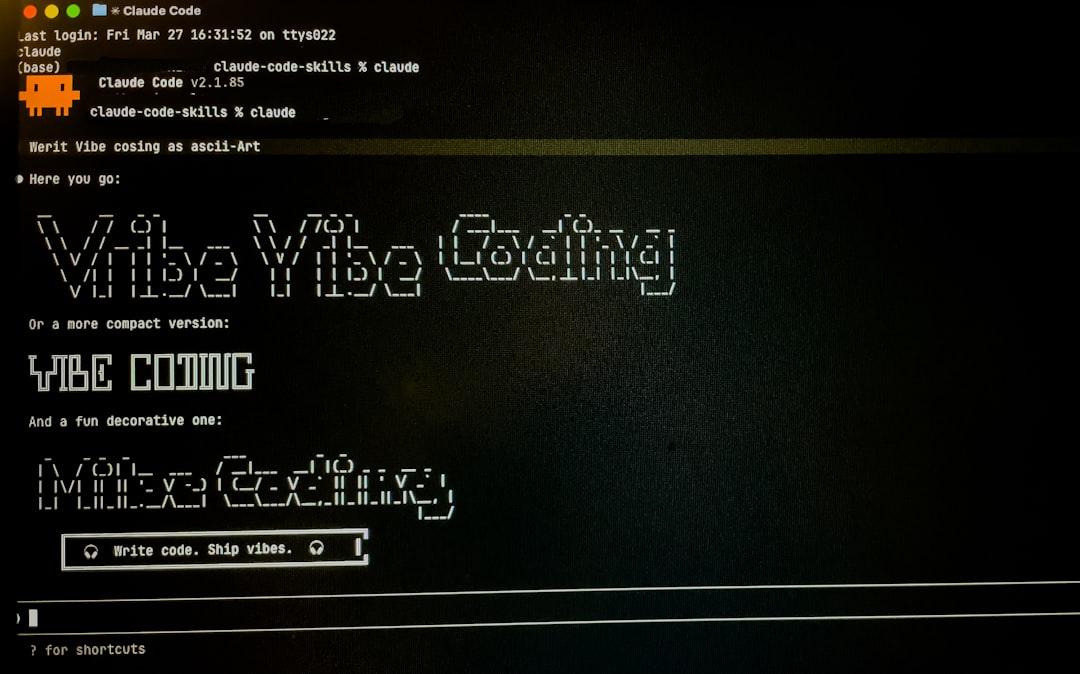
As noted in the Slack Marketplace, combining AI and collaborative tools is expected to drive further innovation in workplace technologies. Organizations that embrace these advancements will likely gain a competitive edge. They can leverage data more effectively to inform their strategies.
Looking ahead, the question remains: how will other collaboration platforms respond to Slack’s innovations? As competitors seek to enhance their offerings, we may see new features aimed at improving data visualization and team collaboration across various platforms.
Using Slack for project management enhances team collaboration, reduces the need for multiple applications, and allows for real-time updates and communication.
Frequently Asked Questions
How do I create interactive charts in Slack?
To create interactive charts in Slack, describe your reporting needs to Slackbot. The AI will gather information from your conversations and connected apps to generate the charts you need.
What are the benefits of using Slack for project management?
Using Slack for project management enhances team collaboration, reduces the need for multiple applications, and allows for real-time updates and communication. This makes it easier to manage projects efficiently.
How can data analysts leverage new Slack features for reporting?
Data analysts can use Slack’s new vibe-coding feature to create interactive reports and visualizations directly within chats. This streamlines their workflow and improves communication with team members.
You may also like
 AI & Technology
Apple Restricts Mac Disk Access Amid AI Risks
Apple's new restrictions on disk access for Mac users aim to enhance security and privacy in response to rising risks from AI agents. Applications will…
Read More →